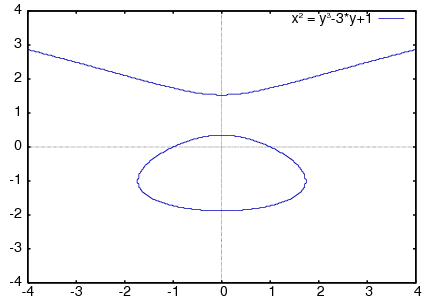
Displays a plot of one or more expressions in implicit
form. expr is the expression to be plotted, x_range the
range of the horizontal axis and y_range the range of vertical
axis. implicit_plot respects global setting for the gnuplot
driver set by the set_plot_option function. Options can also be passed to
implicit_plot function as optional arguments.
implicit_plot works by tracking sign changes on the area
given by x_range and y_range and can fail for complicated
expressions.
load(implicit_plot) loads this function.
Example:
(%i1) implicit_plot (x^2 = y^3 - 3*y + 1, [x, -4, 4], [y, -4, 4],
 [gnuplot_preamble, "set zeroaxis"]);

·
@ref{Category: Plotting} · @ref{Category: Share packages} · @ref{Category: Package implicit_plot}